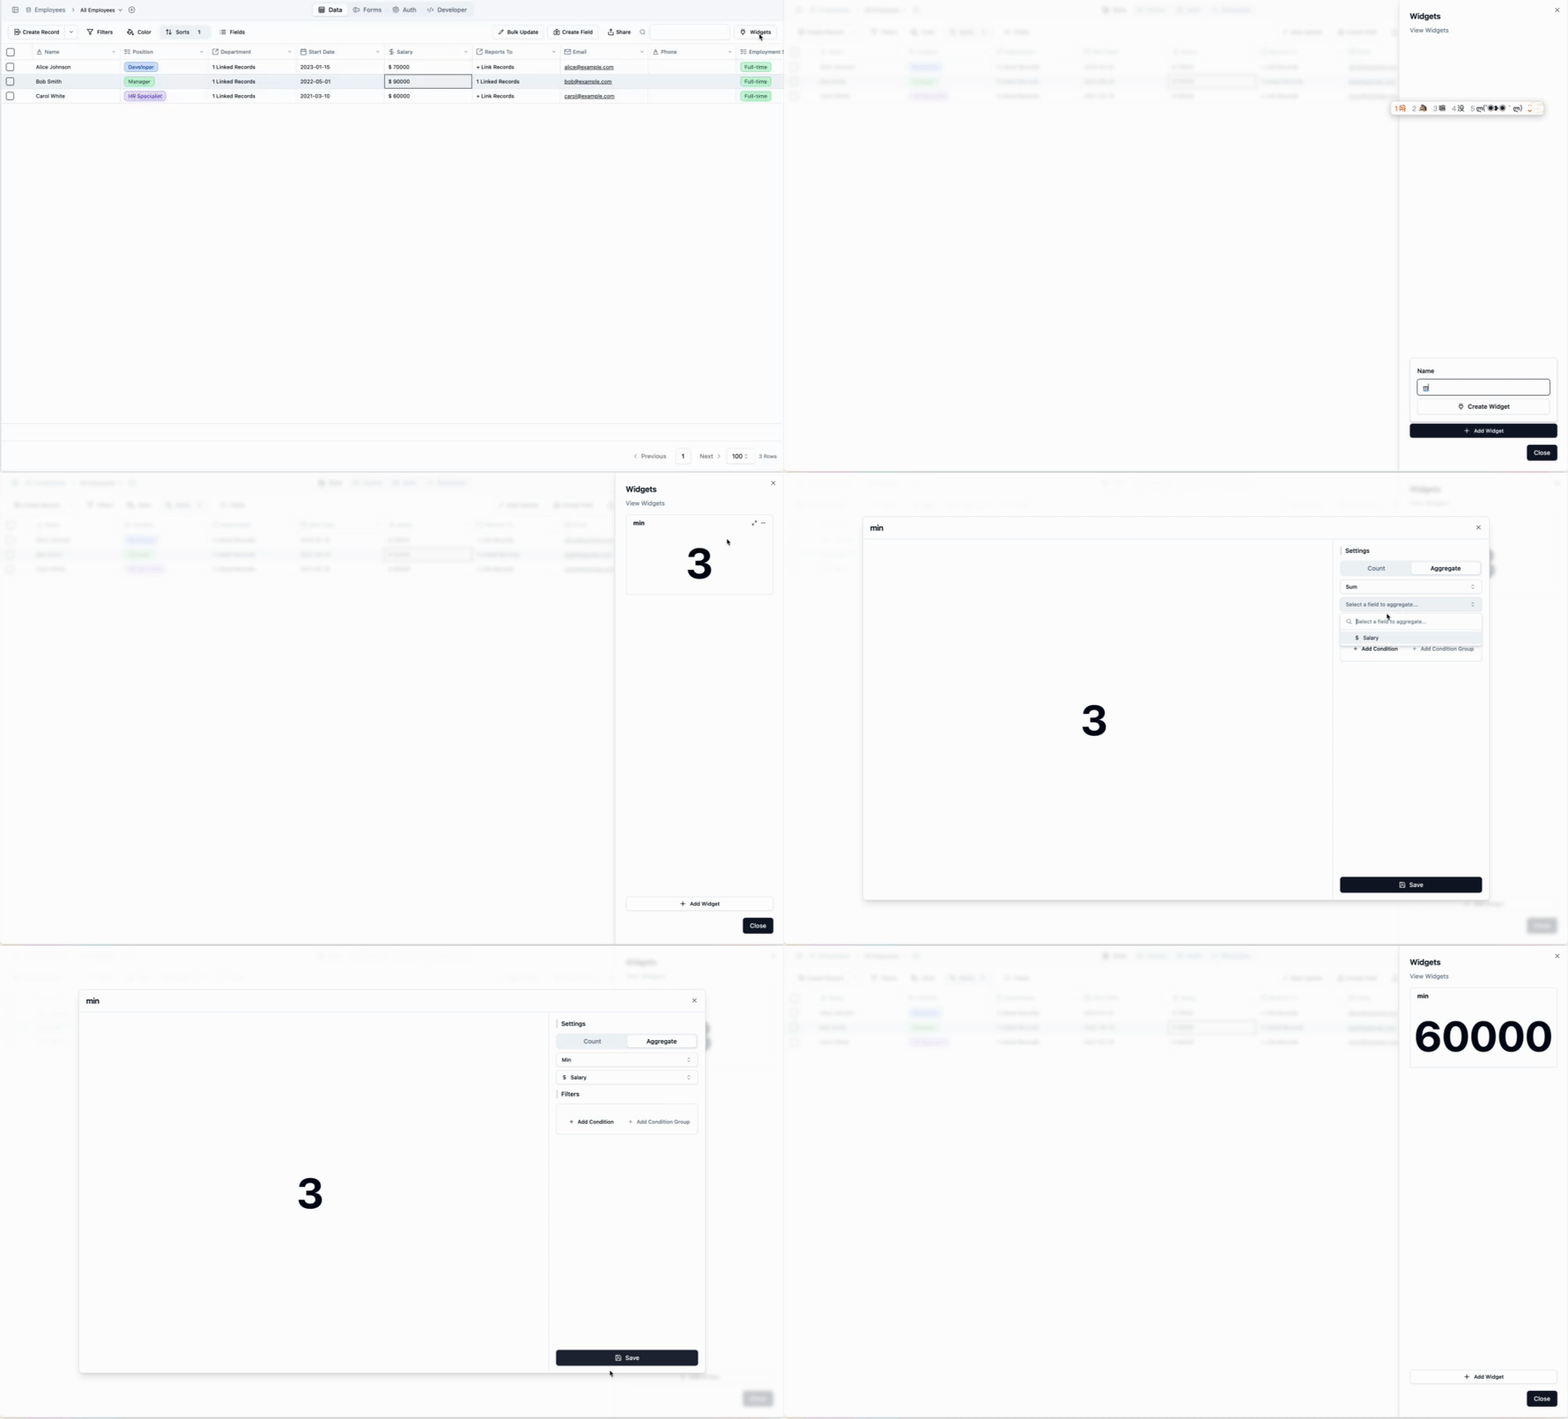
View Widgets
In undb, users can now create widgets in views to visually display data statistics. Each widget can be used to quickly understand the overall status of the data in a table, such as counting the number of records or performing aggregate calculations on numeric fields.

How to Create a Widget
- Open or Create a View: Navigate to the view where you want to add a widget.
- Click Add Widget Button: Find and click the “Add Widget” button on the view page.
- Select Statistic Type: In the popup window, select the type of widget you want to display.
Currently, the following types of statistics are supported:
- Count: Count the total number of records.
- Sum: Calculate the sum of a selected numeric field.
- Average (Avg): Calculate the average value of a selected numeric field.
- Minimum (Min): Find the minimum value of a selected numeric field.
- Maximum (Max): Find the maximum value of a selected numeric field.
Note: Except for Count, other statistics require the user to select a numeric field.
Use Cases
- Count: Suitable for counting the total number of records, such as the number of customers or orders.
- Sum: Useful for viewing the total of certain numeric fields, such as the total amount of all orders.
- Average: Helps to understand average values, such as average order amount or average rating.
- Min and Max: Used to view extremes in data, such as the lowest stock quantity or highest rating.
By adding these widgets to a view, users can more efficiently understand the overall state of their data and gain key insights at a glance.