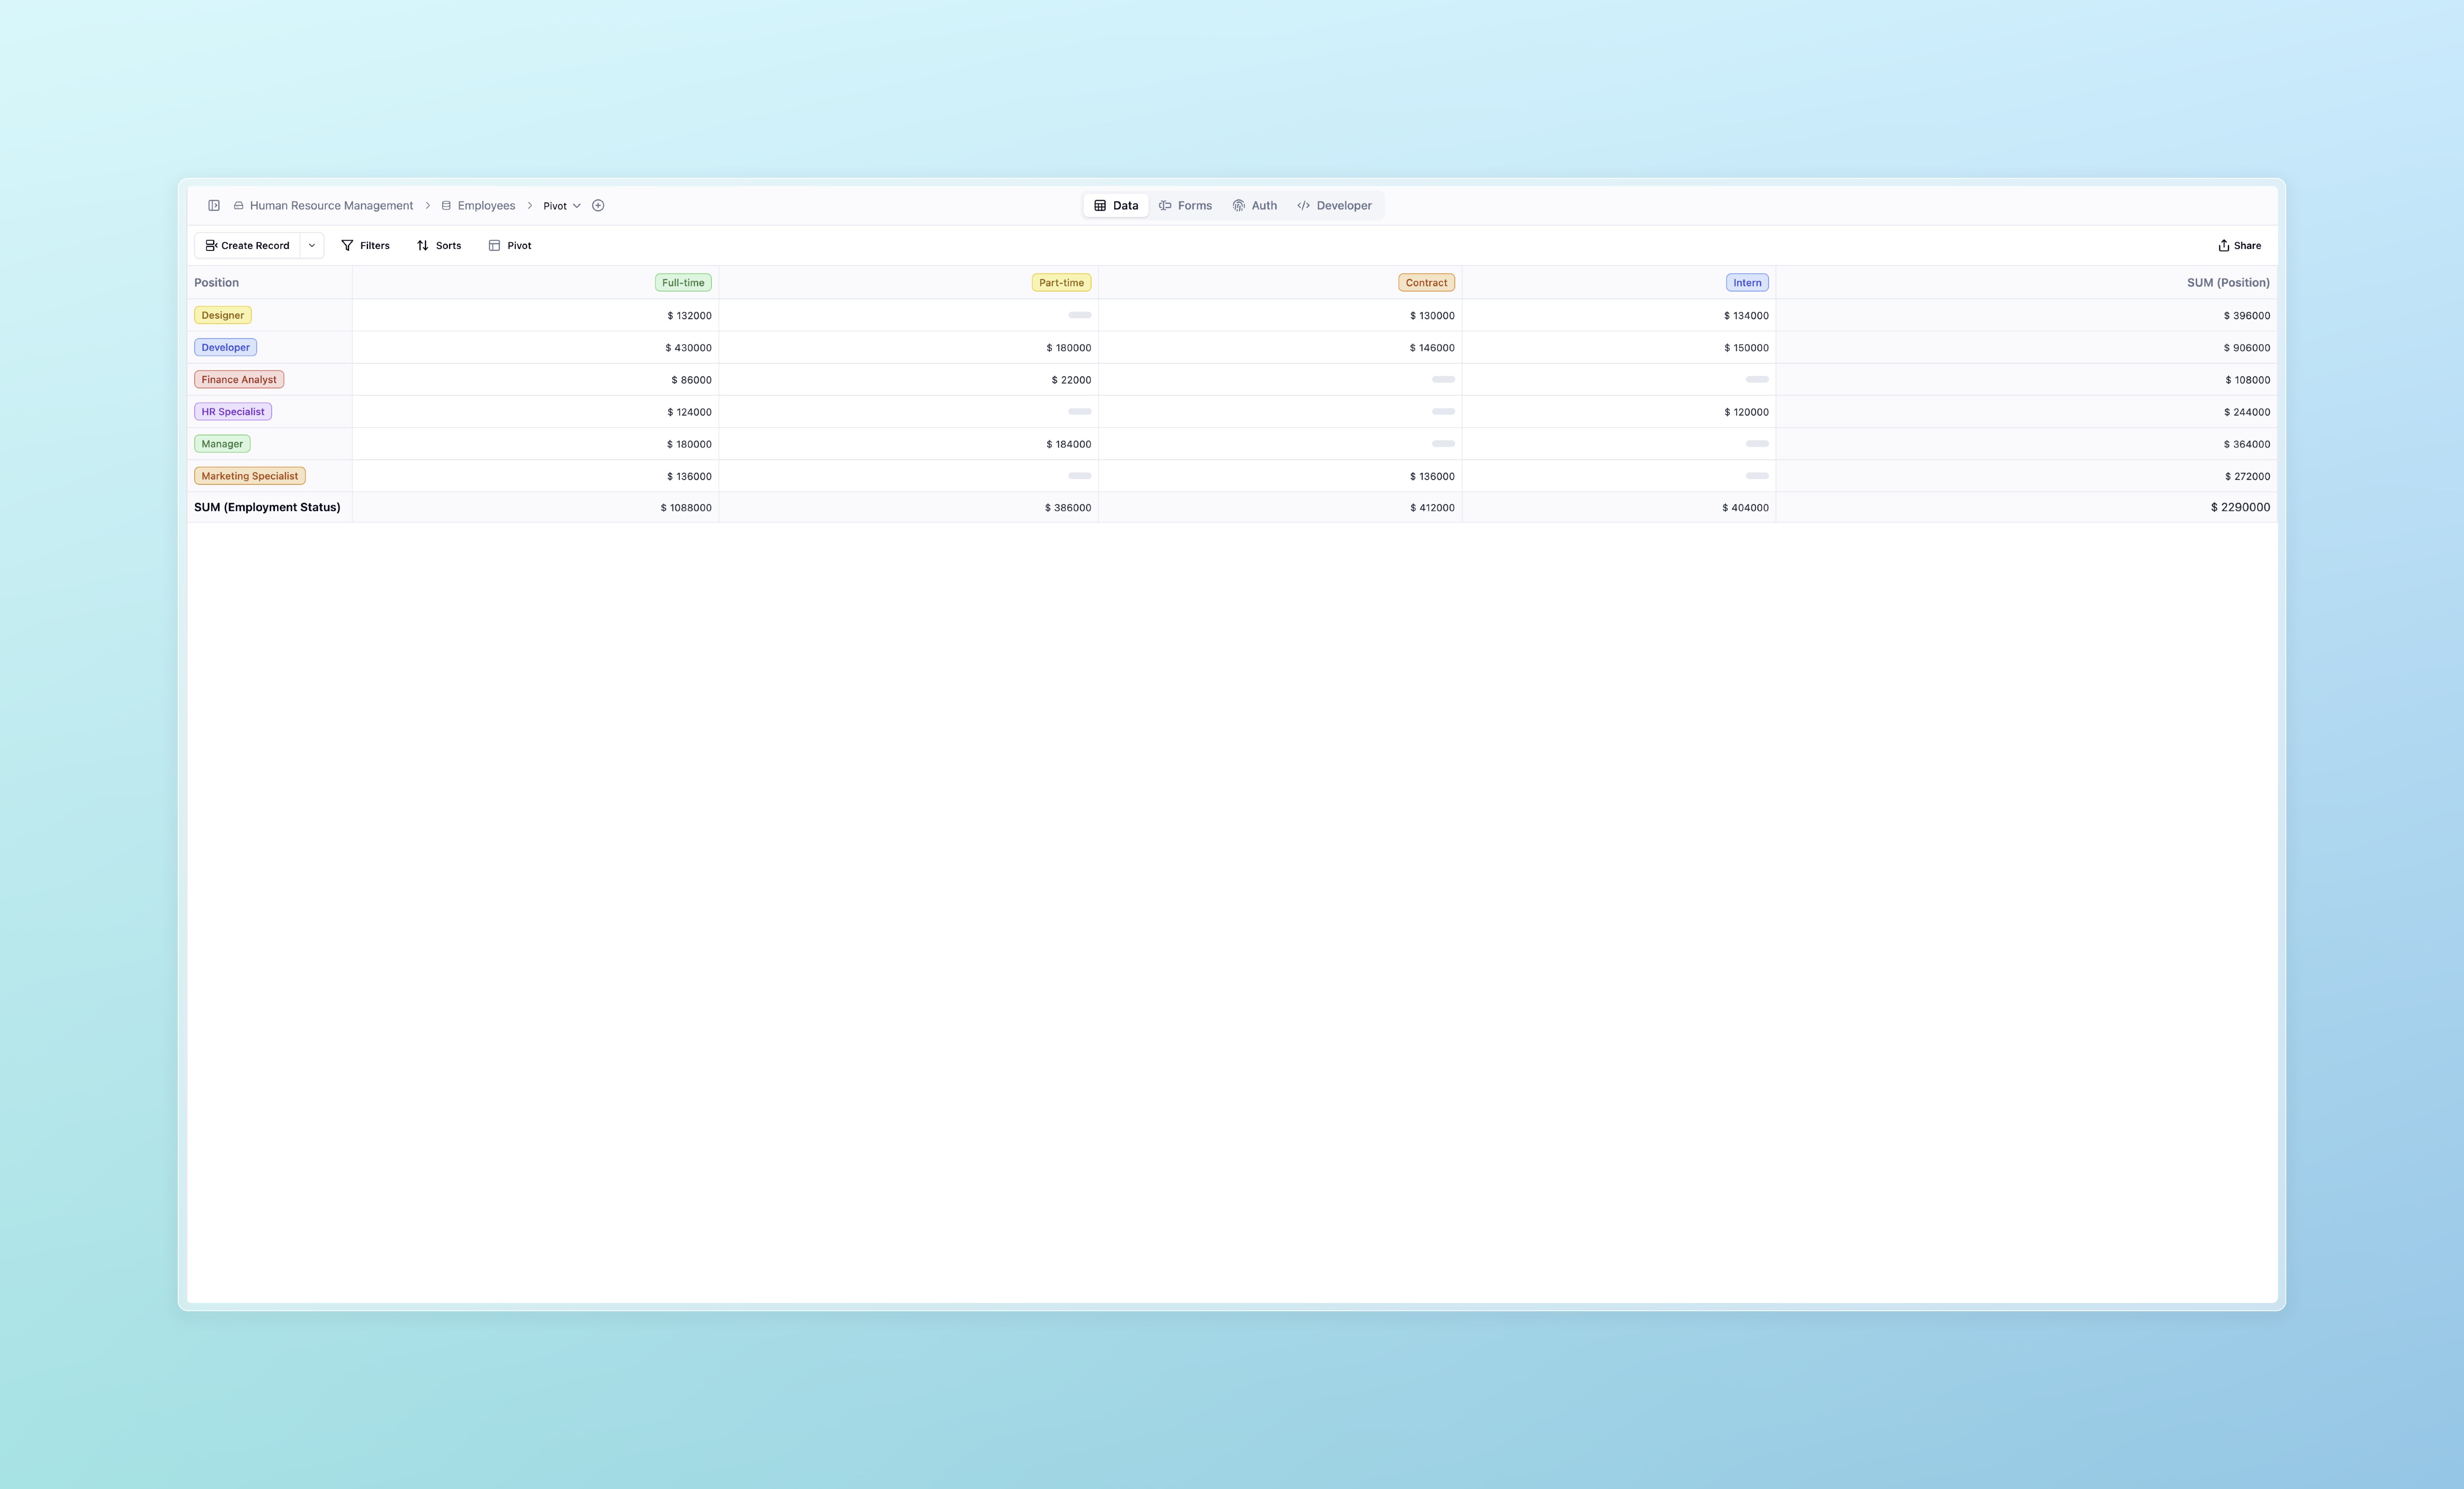
Pivot View
Pivot View
Pivot View is a versatile data visualization tool that allows users to aggregate and analyze table data from multiple dimensions by configuring rows, columns, and data aggregation methods. With Pivot View, you can categorize and calculate data from various perspectives, such as summing sales data, calculating averages, or grouping project data by user roles.

Use Cases
Pivot View is ideal for scenarios like:
- Financial Reporting: Summarize sales, profit, and other metrics by product category, enabling quick comparisons of performance across categories.
- Project Management: Track tasks across projects or teams, showing counts of tasks or progress in each grouping.
- Human Resources: Organize employee data, such as headcounts or role distributions, by department or location.
- Customer Analysis: Analyze customer data by demographics or purchase behavior, aggregating purchase amounts, frequency, etc.
Key Features
- Aggregation Options: Pivot View supports several aggregation types for flexibility in data summarization:
- Sum: Adds up values, suitable for calculating totals (e.g., total revenue)
- Count: Counts records in each category, useful for tracking quantities (e.g., number of tasks)
- Average: Calculates the average value, ideal for metrics like average score or satisfaction rating
- Max/Min: Displays the highest or lowest values, useful for showing peaks or minimums in data
How to Use Pivot View
-
Create a Pivot View:
- Go to the view options and select Pivot View
- Choose fields for the Row Label and Column Label to define how your data will be grouped
- Select a Value field for aggregation, such as numeric or percentage fields
-
Configure Aggregation:
- Set an aggregation type (e.g., Sum, Count) based on the analysis you want
- For example, use Count for task totals or Sum for revenue
-
Save and View:
- Save your configuration. Pivot View will display the data table, grouped and calculated based on your selected rows, columns, and aggregation settings
Tips for Using Pivot View
- Selecting Labels: Use single-choice fields for Row and Column Labels to categorize data effectively
- Value Fields: Choose a numeric field for most aggregations (e.g., Sum, Average). For Count, any field can be used
- Updating Configurations: You can adjust row, column, and value settings anytime to see different data perspectives
Pivot View allows you to transform your raw data into actionable insights by breaking it down into summarized, manageable formats. This makes it an ideal tool for anyone needing dynamic, data-driven reporting within the platform.